Inspecting Gradle Builds
Gradle provides multiple ways to inspect your build:
-
Profile with build scans
-
Local profile reports
-
Low level profiling
What is a build scan?
Build scans are a persistent, shareable record of what happened when running a build. Build scans provide insights into your build that you can use to identify and fix performance bottlenecks.
In Gradle 4.3 and above, you can create a build scan using the --scan command line option:
$ gradle build --scan
For older Gradle versions, the Build Scan Plugin User Manual explains how to enable build scans.
At the end of your build, Gradle displays a URL where you can find your build scan:
BUILD SUCCESSFUL in 2s
4 actionable tasks: 4 executed

Publishing build scan...
https://gradle.com/s/e6ircx2wjbf7e
This section explains how to profile your build with build scans.
Profile with build scans
The performance page can help use build scans to profile a build. To get there, click "Performance" in the left hand navigation menu or follow the "Explore performance" link on the build scan home page:
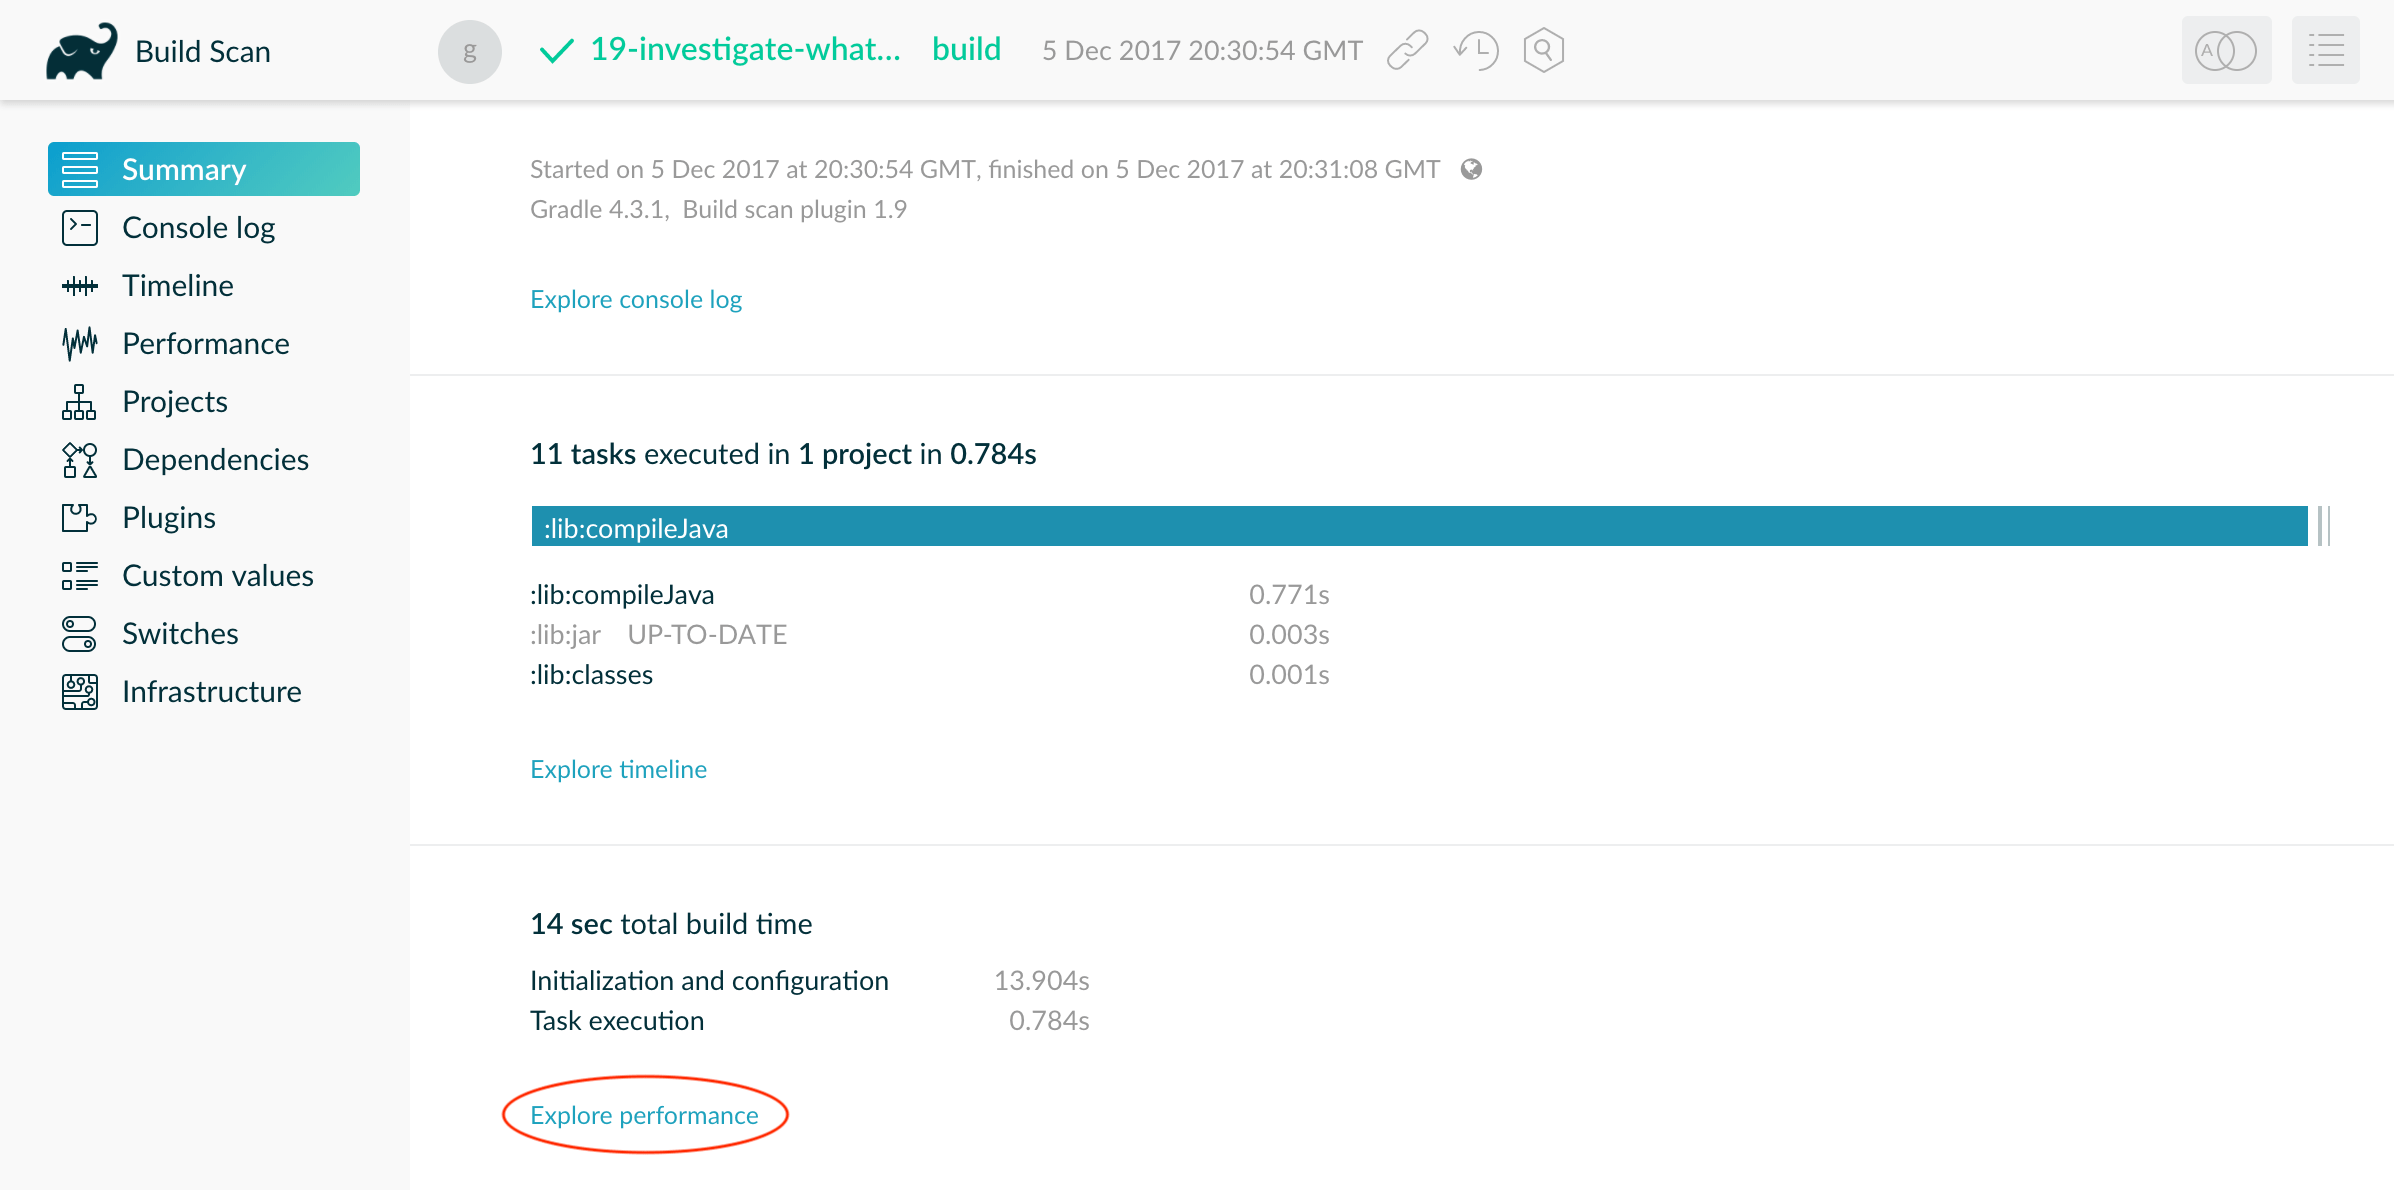
The performance page shows how long it took to complete different stages of a build. This page shows how long it took to:
-
start up
-
configure the build’s projects
-
resolve dependencies
-
execute tasks
You also get details about environmental properties, such as whether a daemon was used or not.
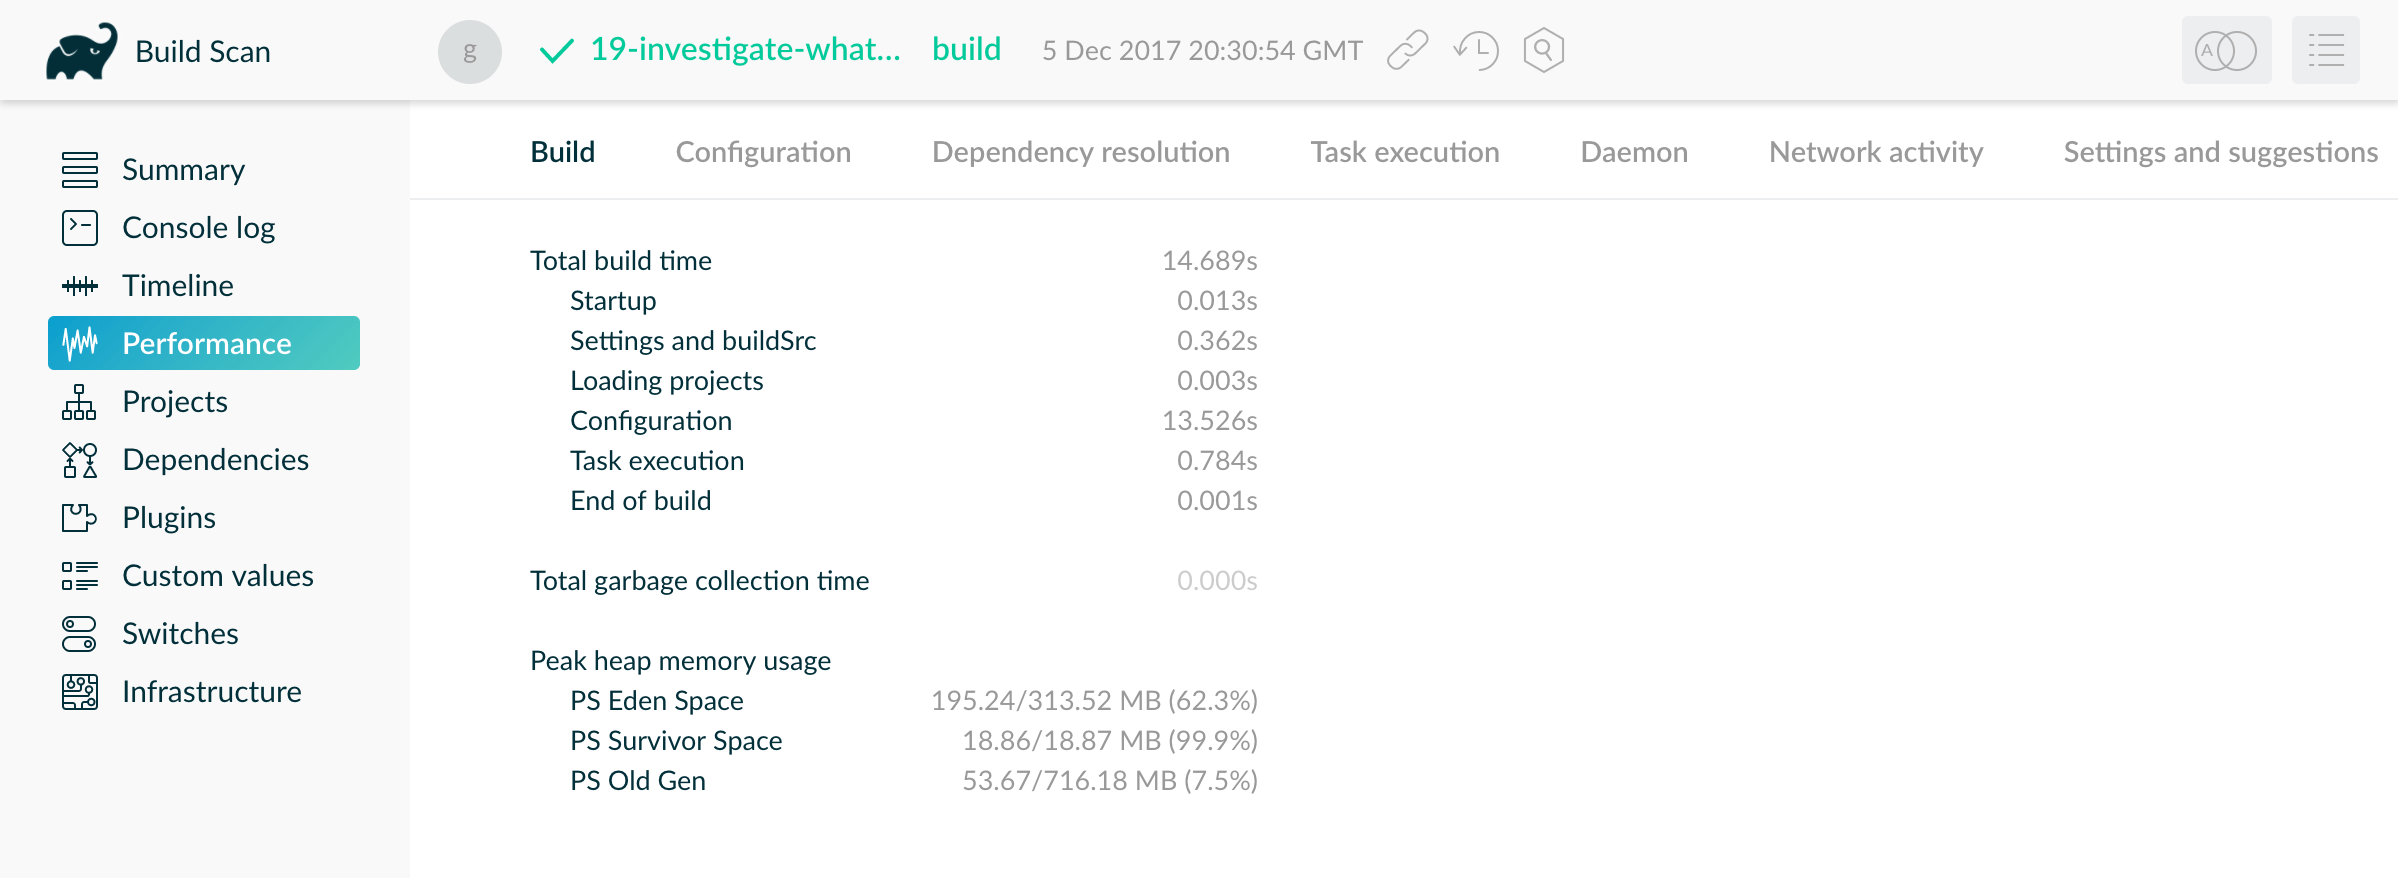
In the above build scan, configuration takes over 13 seconds. Click on the "Configuration" tab to break this stage into component parts, exposing the cause of the slowness.
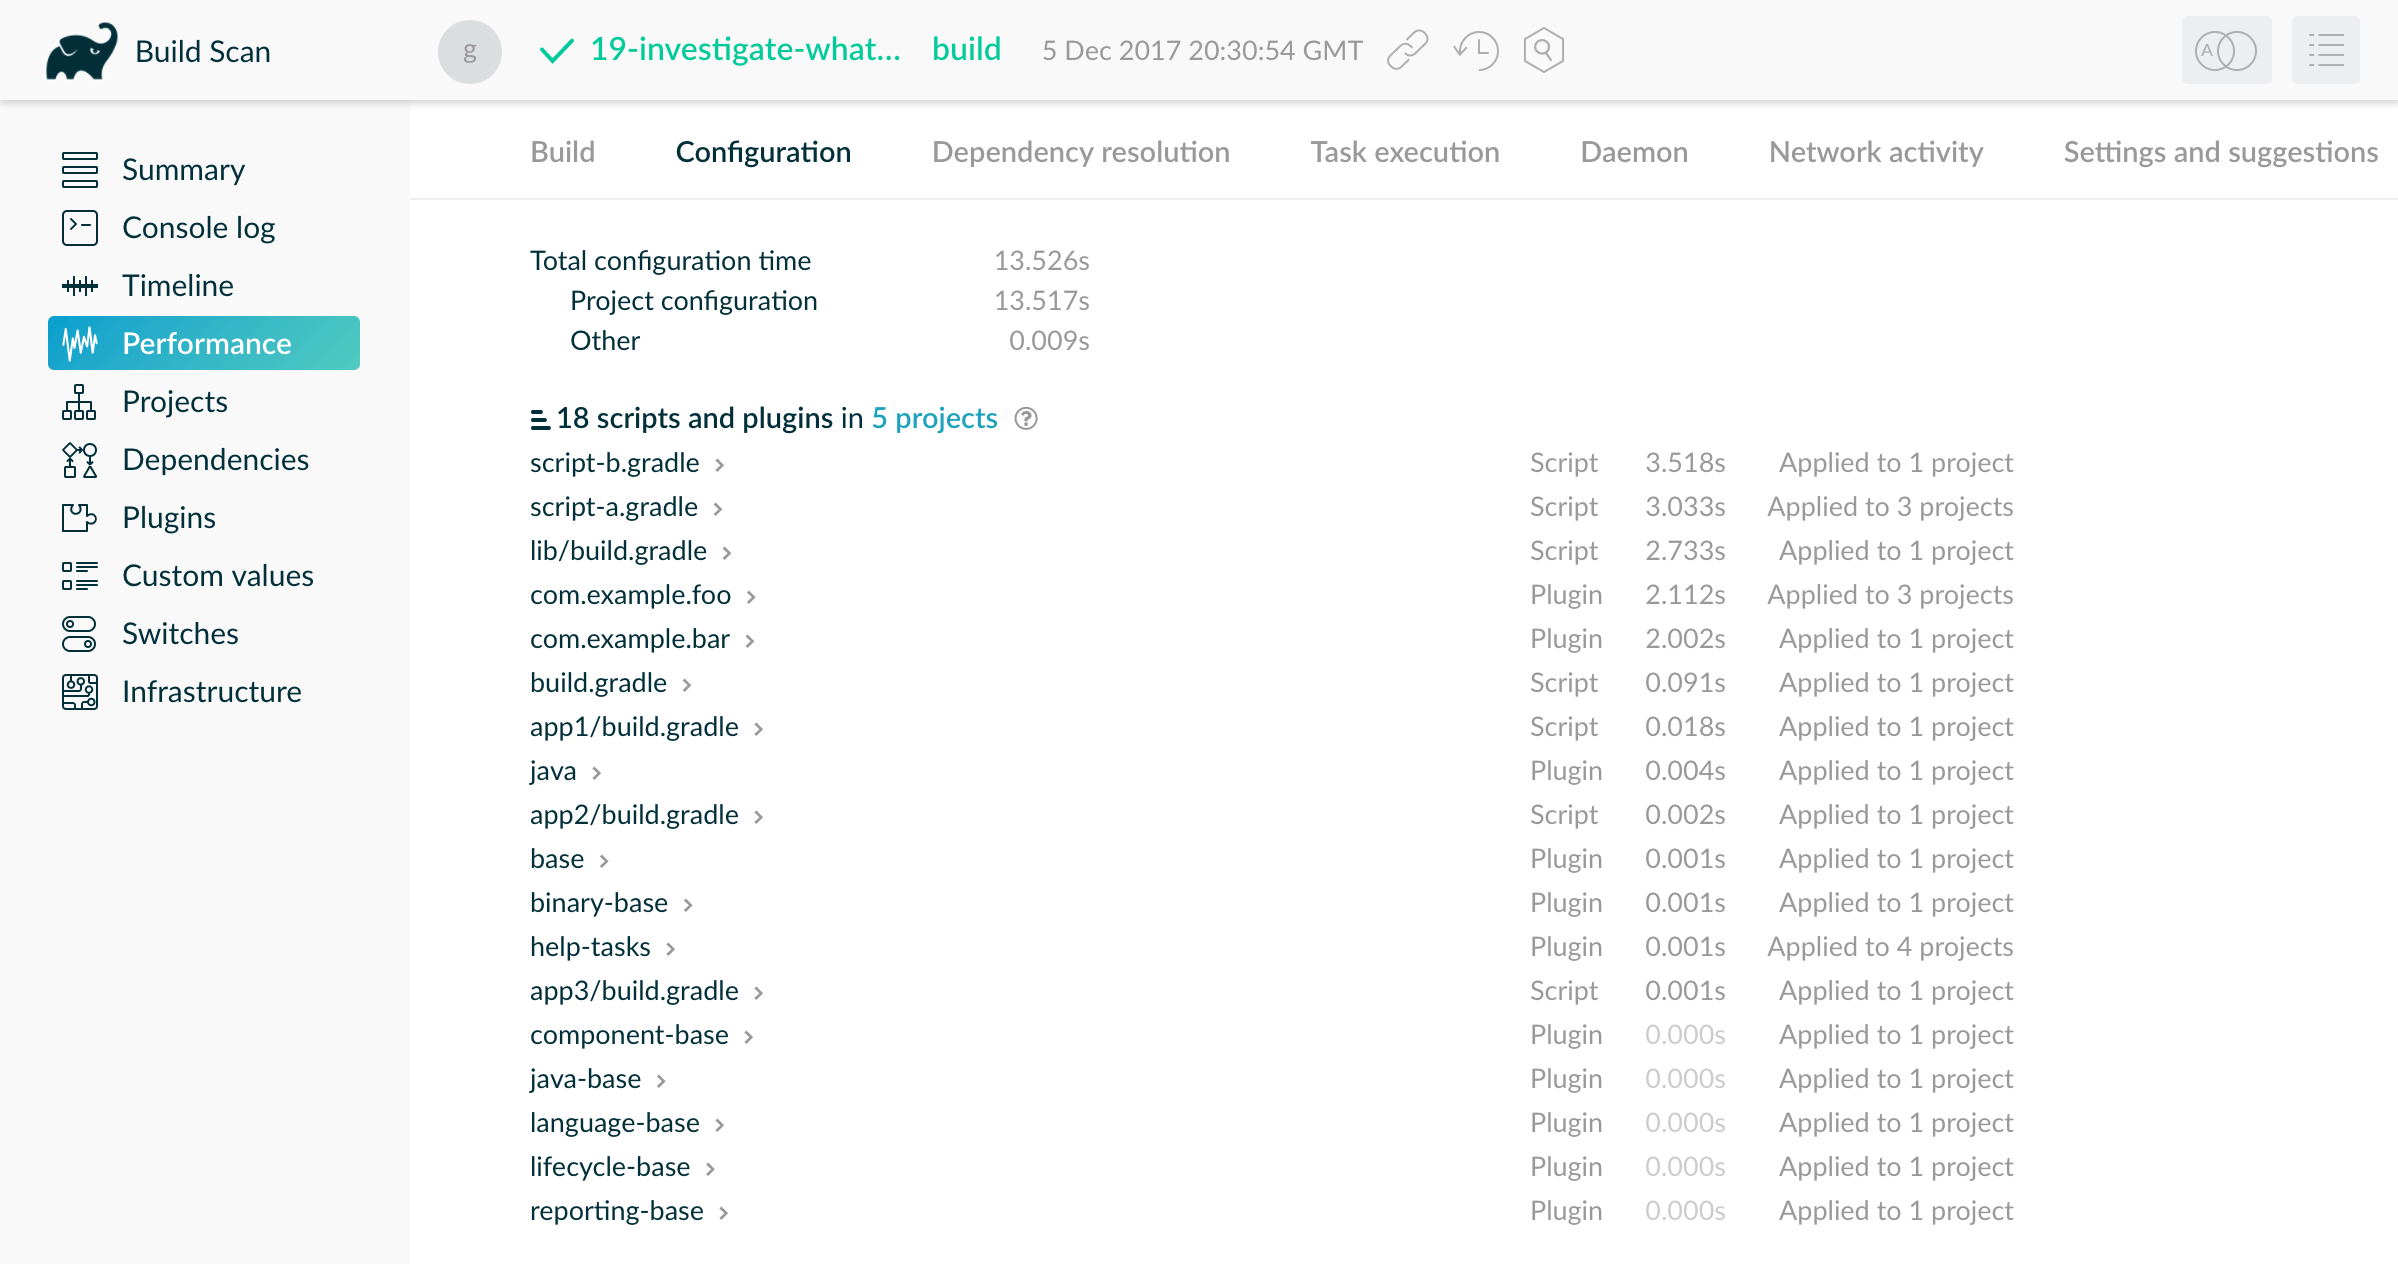
Here you can see the scripts and plugins applied to the project in descending order of how long they took to apply.
The slowest plugin and script applications are good candidates for optimization.
For example, the script script-b.gradle was applied once but took 3 seconds.
Expand that row to see where the build applied this script.
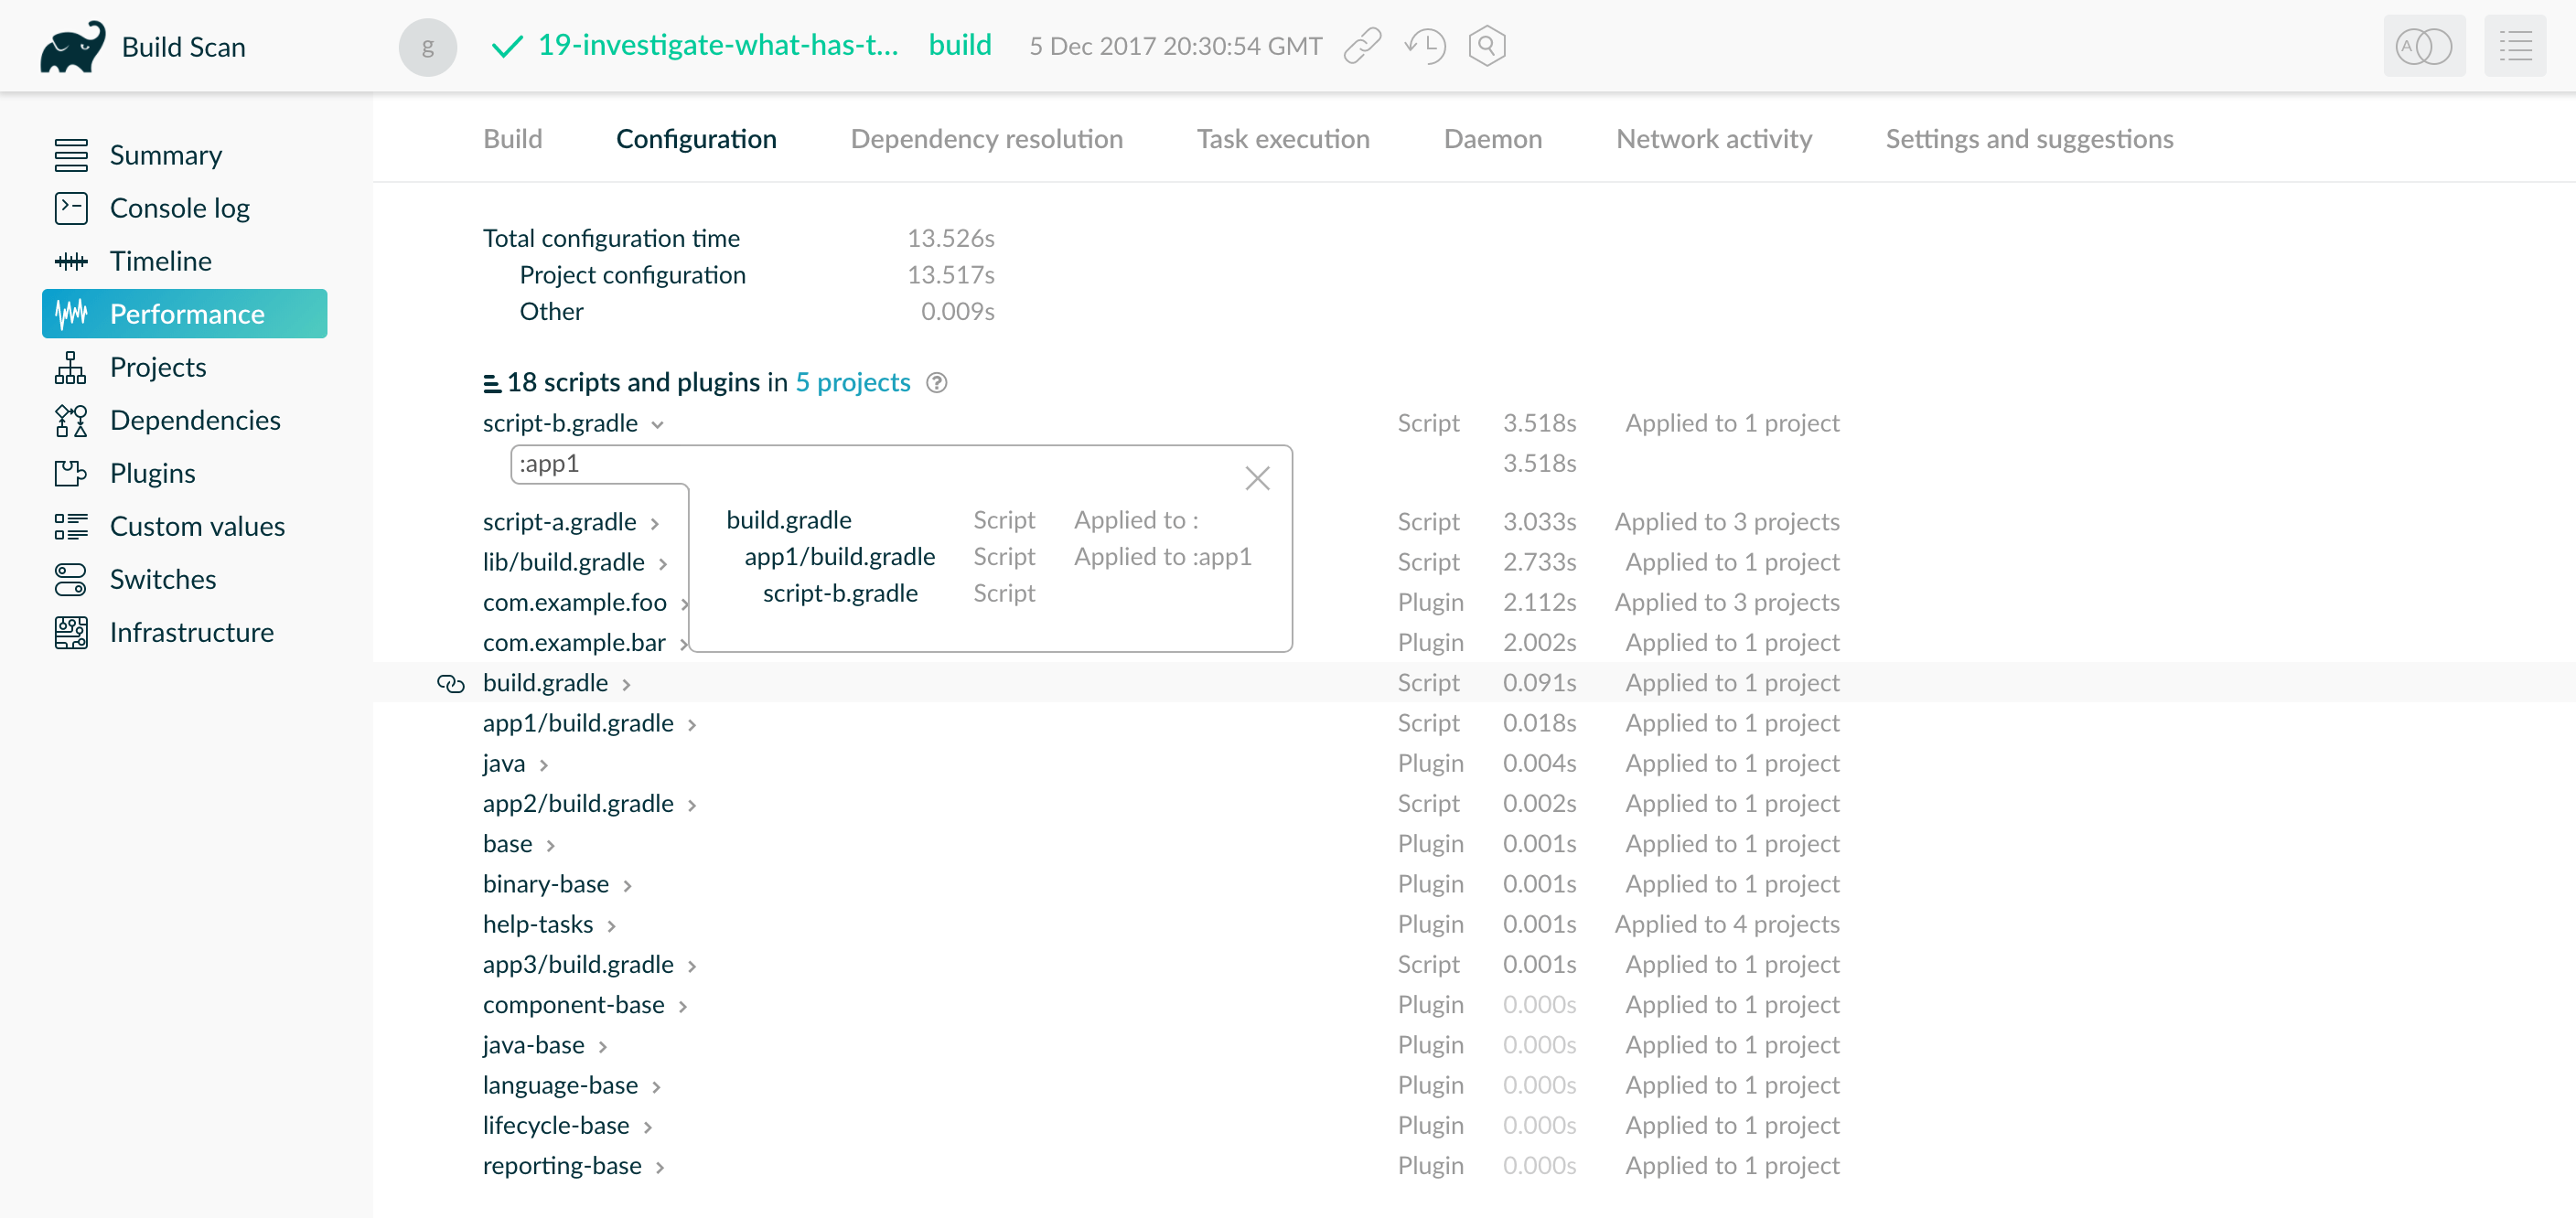
You can see that subproject :app1 applied the script once, from inside of that subproject’s build.gradle file.
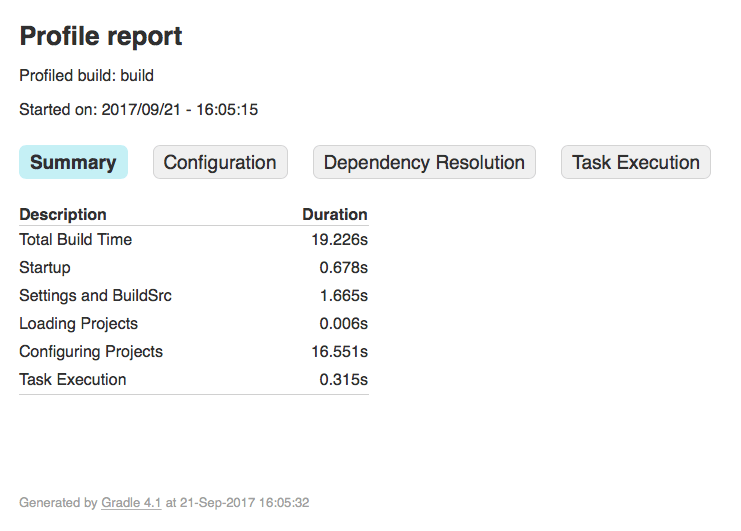
Profile report
If you prefer not to use build scans, you can generate an HTML report in the
build/reports/profile directory of your root project. To generate this report,
use the --profile command-line option:
$ gradle --profile <tasks>
Each profile report has a timestamp in its name to avoid overwriting existing ones.
The report displays a breakdown of the time taken to run the build. However, this breakdown is not as detailed as a build scan. The following profile report shows the different categories available:
Low level profiling
Sometimes your build can be slow even though your build scripts do everything right. This often comes down to inefficiencies in plugins and custom tasks or constrained resources. Use the Gradle Profiler to find these kinds of bottlenecks. With the Gradle Profiler, you can define scenarios like "Running 'assemble' after making an ABI-breaking change" and run your build several times to collect profiling data. Use the Profiler to produce build scans. Or combine it with method profilers like JProfiler and YourKit. These profilers can help you find inefficient algorithms in custom plugins. If you find that something in Gradle itself slows down your build, don’t hesitate to send a profiler snapshot to performance@gradle.com.
Performance categories
Both build scans and local profile reports break down build execution into the same categories. The following sections explain those categories.
Startup
This reflects Gradle’s initialization time, which consists mostly of:
-
JVM initialization and class loading
-
Downloading the Gradle distribution if you’re using the wrapper
-
Starting the daemon if a suitable one isn’t already running
-
Executing Gradle initialization scripts
Even when a build execution has a long startup time, subsequent runs usually see a dramatic drop off in startup time. Persistently slow build startup times are usually the result of problems in your init scripts. Double check that the work you’re doing there is necessary and performant.
Settings and buildSrc
After startup, Gradle initializes your project. Usually, Gradle only processes your settings file.
If you have custom build logic in a buildSrc directory, Gradle also processes that logic.
After building buildSrc once, Gradle considers it up to date. The up-to-date checks take significantly less time than logic processing.
If your buildSrc phase takes too much time, consider breaking it out into a separate project.
You can then add that project’s JAR artifact as a dependency.
The settings file rarely contains code with significant I/O or computation. If you find that Gradle takes a long time to process it, use more traditional profiling methods, like the the Gradle Profiler, to determine the cause.
Loading projects
It normally doesn’t take a significant amount of time to load projects, nor do you have any control over it. The time spent here is basically a function of the number of projects you have in your build.